News & Events
Press Releases
September Business Survey Index (BSI) Released
|
Internal & External Risks,Concerns over Sluggish Domestic Demand Dragged BSI down to 92.9
in September (from 97.1 in August)
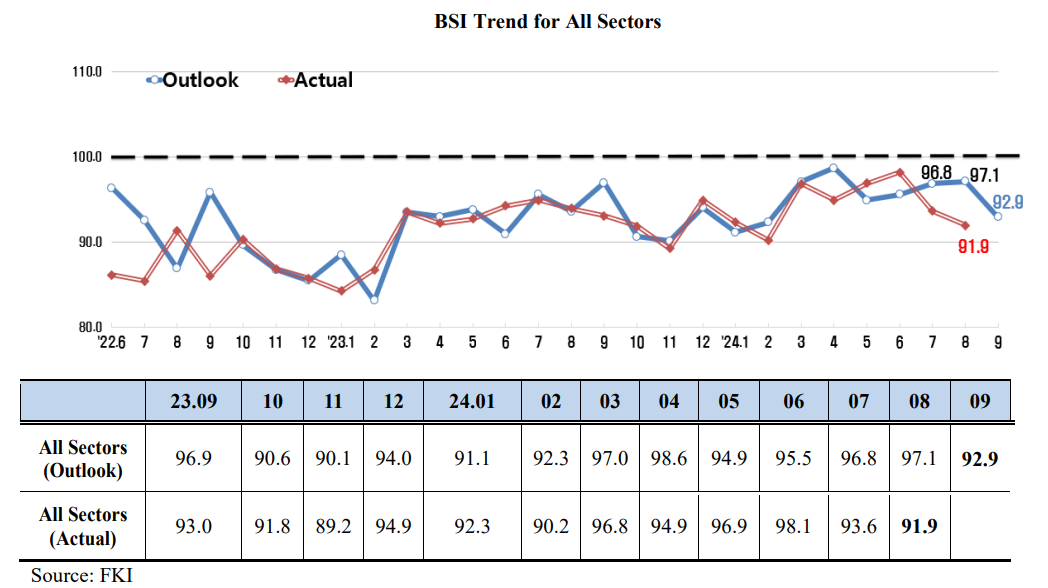
• Overall BSI outlook (92.9) has stalled after the its upward trend that began this past May.
*Overall BSI: 94.9 (May ‘24), 95.5(Jun.), 96.8(Jul.), 97.1(Aug.), 92.9(Sept.)
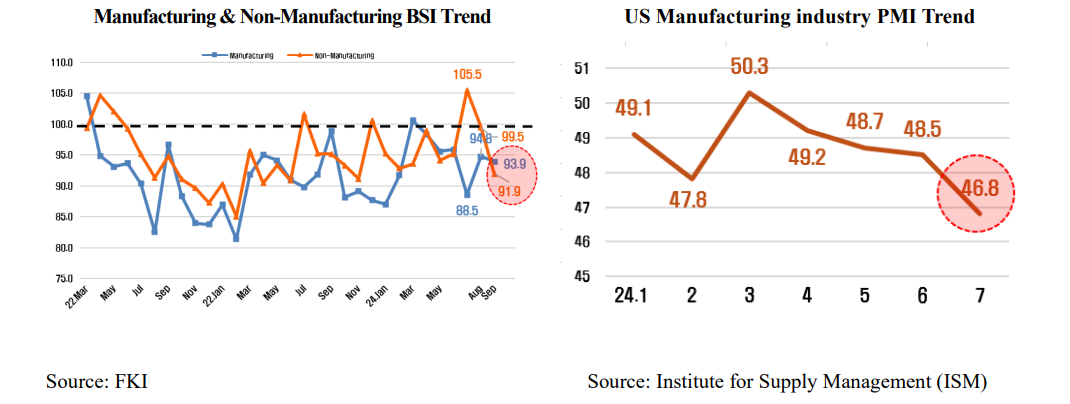
• [BSI by Sector] Both the manufacturing (93.9) and non-manufacturing (91.9) sectors showed lackluster performance for two months
• [BSI by Survey Field] Domestic demand (96.3), Export (94.5), and Investment (91.4) all saw worsening performances for three months
* Domestic demand (96.3): Sluggish results for 27 months straight since July 2022 (95.8)
* Export (94.5): Index plunged the most (△4.7p) after 25 months since the dip in August 2022 (△5.1p)
• Efforts to stabilize interest rates are deemed necessary to minimize internal and external uncertainties
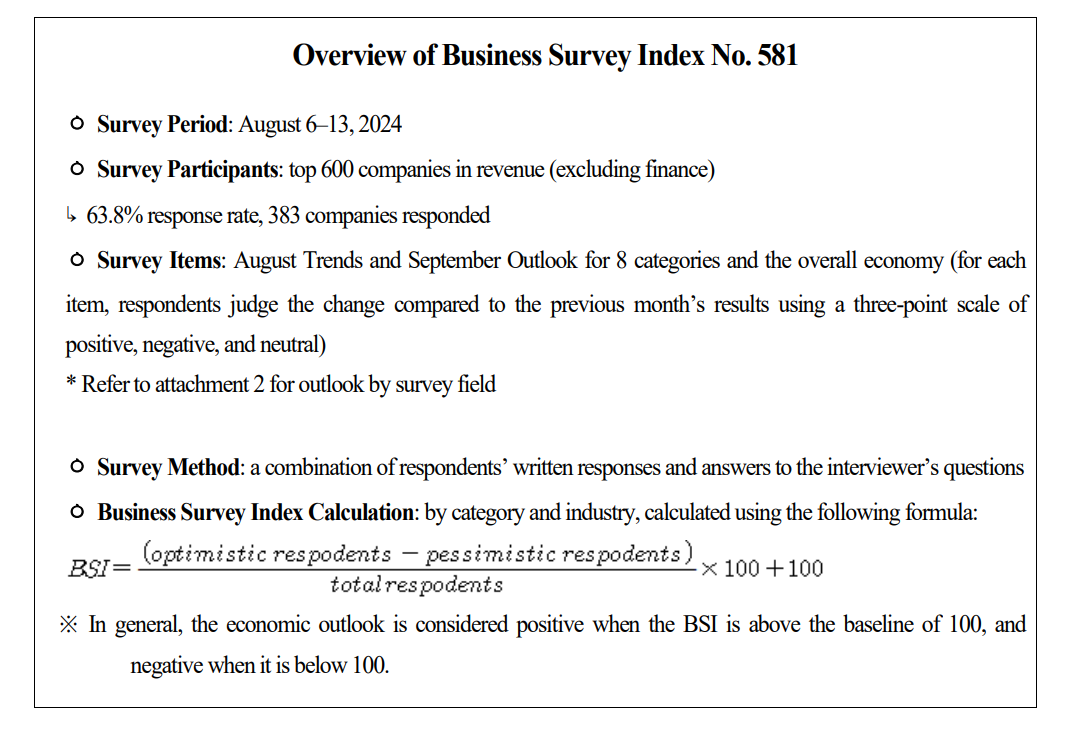
The Federation of Korean Industries (FKI)’s Business Survey Index (BSI), a survey of the business sentiment of the largest 600 Korean companies in revenue, recorded an outlook for September of 92.9, falling short of the baseline of 1001. It fell 4.2 points from the previous month (97.1).
1 If the BSI is over 100, business sentiment is more positive about the economy than the previous month and vice versa.
2 BSI Outlook: 94.9 (May ‘24) → 95.5 (Jun.) → 96.8 (Jul.) → 97.1 (Aug.) → 92.9 (Sept.)
3 Major countries’ outlook for economic growth rate (IMF, ’24.7) : [US] 2.7%→2.6%, [Japan] 0.9%→0.7%
4 Private Consumption (BOK, QoQ, %): 0.1 (23.3Q) → 0.4 (4Q) → 0.7 (24.1Q) → △0.2 (2Q)
The actual BSI for August was 91.9, 1.7 points lower than the last month (93.6).
The manufacturing sector (93.9) and non-manufacturing sector (91.9) both reported grim business outlooks for September. The former (93.9) showed a sluggish performance stemming from the growing internal and external risks such as US real economy slowdown5, sluggish Chinese economy6, and weakened domestic demand.
5 US Manufacturing PMI (ISM): 50.3(Mar, ’24)→ 49.2(Apr)→ 48.7(May)→ 48.5(Jun)→ 46.8(Jul)
6 Chinese GDP growth rate (24.2Q, Reuter·National Bureau of Statistics of China): (Outlook) 5.1% VS. (Actual) 4.7%
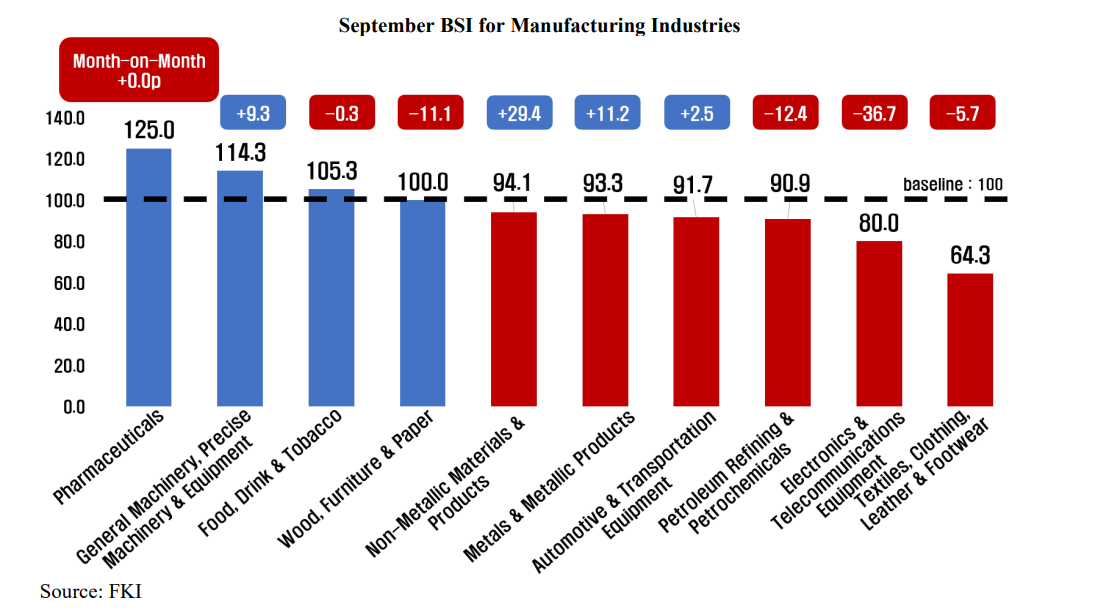
Among the September outlooks for the manufacturing sector by industry (10 in total), pharmaceuticals (125.0); general machinery, precision machinery and equipment (114.3); and food, beverages and tobacco (105.3) demonstrated a positive outlook, while the expectations for the six other industries9 besides wood, furniture and paper, which sat around the baseline, shared a negative business sentiment.
9 ▸Textile/Clothing and Leather/Shoes (64.3) ▸Electronics & telecommunications equipment (80.0) Petroleum refining and petrochemicals (90.9) ▸Automotive & transportation equipment (91.7) ▸Metals & metallic products (93.3) ▸Non-metallic materials & products (94.1)
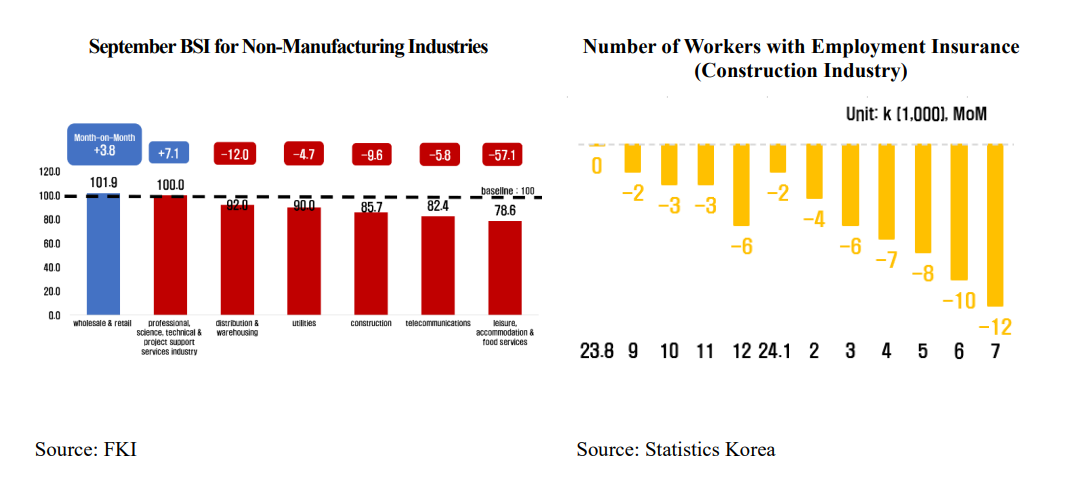
In the non-manufacturing sector (7 industries in total), wholesale and retail (101.9) showed a positive outlook. Besides professional, science, technical & project support services, which remained around the baseline, the other five industries10 reflected negative business sentiment. Leisure, accommodation & food services (78.6) will be the lowest among the seven, considering that summer vacation has ended.
10 ▸Leisure, accommodation & food services (78.6) ▸Telecommunications (82.4) ▸Construction (85.7) ▸Utilities (90.0) ▸Distribution and warehousing (92.0)
According to the September BSI, a business slowdown is projected across all industries (domestic demand (96.3), Export (94.5), employment (94.0), funds (93.7), profitability (92.9), Investment (91.4) and inventories (102.6)11)
11 If inventory surpasses the baseline (100), it casts a negative outlook (Overstock)
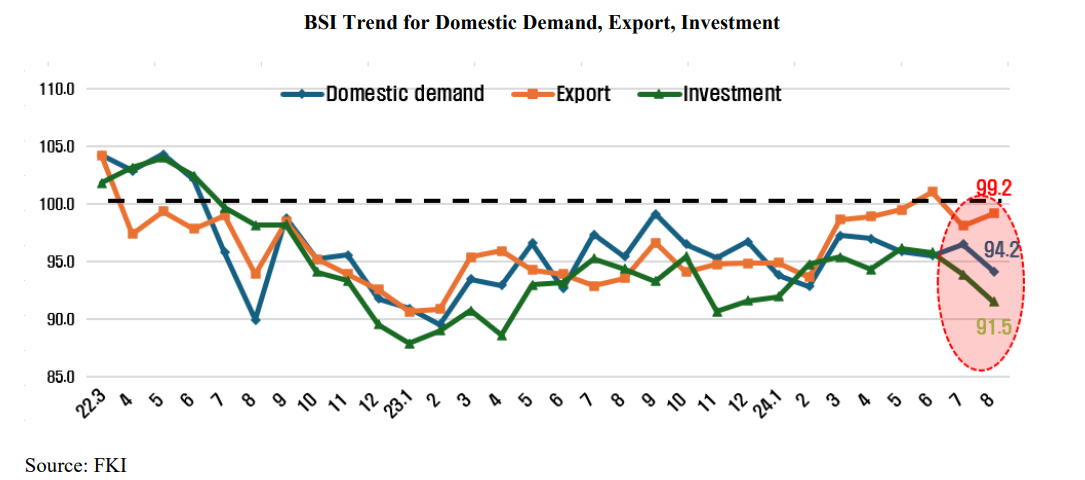
Domestic demand (96.3), Export (94.5), and investment (91.4) have been particularly slow over the three months since the July outlook. Domestic demand (96.3) has been under the baseline since July 2022 (95.8) for a consecutive 27 months12, as pressure from high interest rates have caused households to curb their spending.
12 Domestic demand BSI Outlook : 95.8 (Jul. ‘22), 89.9 (Aug.), 98.8 (Sept.), 95.2 (Oct.), 95.6 (Nov.), 91.8 (Dec.), 90.9 (Jan. ‘23), 89.5 (Feb.), 93.5 (Mar.), 93.0 (Apr.), 96.6 (May), 92.7 (Jun.), 97.4 (Jul.), 95.4 (Aug.), 99.2 (Sept.), 96.5 (Oct.), 95.3 (Nov.), 96.7 (Dec.), 93.8 (Jan. ‘24), 92.8 (Feb.), 97.3 (Mar.), 97.0 (Apr.), 95.9 (May), 95.5 (Jun.), 96.5 (Jul.), 94.2 (Aug.), 96.3 (Sept.)
Export (94.5)13 dropped 4.7 points from the previous month (99.2), the sharpest downturn in 25 months, since August 2022 (5.1 points).
13 Export BSI Outlook: 99.5 (May ‘24) → 101.0 (Jun.) → 98.1 (Jul.) → 99.2 (Aug.) → 94.5 (Sept.)
The FKI stated, “The outlook for business confidence dwindles. The semiconductor industry14 was the main driver of the recent upward trend in Export. If the impact of the semiconductor industry is left out, growth in Export is meager15 . External uncertainties put additional negative pressure on the outlook.”
14 Semiconductor export changes (Ministry of Trade, Industry and Energy·KITA, MoM, %): 56.2 (Jan. ‘24) → 66.7 (Feb.) → 35.7 (Mar.) → 56.1(Apr) → 54.4(May) → 50.9(Jun) → 50.5(Jul, preliminary)
15 Export changes (semiconductor excluded, Ministry of Trade, Industry and Energy·KITA, MoM, %): 12.5 (Jan. ‘24)→ △4.1 (Feb.)→ △3.0 (Mar.)→ 7.3 (Apr.)→ 4.4 (May)→ △3.2 (Jun.)→ 7.6 (Jul., preliminary)
“Growing internal and external uncertainties are attributed to the recent shock in the world capital market, increasing tension in the Middle East and the US-China relationship, and, last, increasing concerns over the sluggish domestic demand,16” said Sang-ho Lee, vice president of the FKI’s Economic and Industrial Research Department.
16 Domestic demand (BOK, QoQ, %) : 0.1(23.3Q) → 0.4(4Q) → 0.7(24.1Q) → △0.2(2Q) Facilities investment (BOK, QoQ, %) : △2.0(23.3Q) → 2.8(4Q) → △2.0(24.1Q) → △2.1(2Q) Construction investment (BOK, QoQ, %) : 1.9(23.3Q) → △3.8(4Q) → 3.3(24.1Q) → △1.1(2Q)
Macro indices such as interest rates and exchange rates should be stabilized to help businesses to better cope with the rapid changes in domestic and international dynamics. Following that, the legislation and amendment of laws that may aggravate the situation, such as the revision of the Commercial Act (expand the scope of fiduciary duty) must be put on hold.”